


You can use the ATR to establish where to place a stop or limit order, as well as when you might want to open or close a trade. Here is how to use ATR indicator in trading and the most popular ATR trading strategies.
Rather than using only your own judgment, some statistical measures of price volatility are available. One of the most popular is the Average True Range (ATR) indicator which measures the average movement for a given currency pair (or stock, commodity, etc.) for a given time period.
How to use this ATR trading guide
To get the most out of this guide, it’s recommended to practice putting this ATR indicator trading strategy into action. The best risk-free way to test these strategies is with a demo account, which gives you access to our trading platform and $50,000 in virtual funds for you to practice with.
Once you’ve found a strategy that consistently delivers positive results, it’s time to upgrade to a fully funded live account where you can apply your newfound edge.
What is the ATR Indicator?
The average true range (ATR) indicator shows how much the price of an asset has been moving over a period of time. In other words, it shows how volatile the asset has been. It helps traders predict how far the price of a currency pair, stock, commodity, or cryptocurrency may move in the future and is also useful when deciding how far away to place a stop loss or a profit target.
The average true range is plotted on a trading chart as a single moving average line, which is calculated by the true ranges. This is usually on a candlestick chart, where volatility and price gaps are easy to spot. These types of charts are useful as traders can use the charts to identify entry and exit points for their positions.
The average true range indicator was originally created for use within the commodities market but has since expanded to a wide range of markets, which include forex trading, stock trading, and even cryptocurrency trading. The indicator can also be used for long-term and short-term trading strategies, such as position trading, swing trading, day trading, and scalping.
The ATR indicator was first described in 1978 by famous technical analyst J. Welles Wilder Jr., the father of several technical indicators, including Relative Strength Index (RSI), Average Directional Index (ADX), and the Parabolic SAR.
How does the ATR work?
The ATR works by creating an average of the true range, which is the classic measurement of the range of movement in an asset’s price. The average true range, in contrast, is a smoothed moving average of the true range values, which seeks to make assessing an asset’s volatility easier and more accessible for traders.
The ATR indicator is a type of moving average of the asset's price movement, usually over a period of 14 days, but it can vary depending on your trading strategy.
When the line goes up, this means that the volatility of the asset is increasing. When the line goes down, this means that the volatility is decreasing. The ATR does not show you which direction the asset is moving.
The US Tech100 chart below shows how the ATR shows high and low volatility:


Using the ATR value is optimal for placing a stop loss, because it allows you to place your stop loss the maximum distance away and avoid any market noise, whilst using the shortest stop loss possible to do so.
Please note that the average true range does not represent or suggest market trends, only volatility and price gaps. As always, technical indicators tend to work well in conjunction with others; in this case, an indicator that could be used alongside the average true range to measure trend strength is the average directional index (ADX). Other indicators that can help assess volatility levels include Bollinger bands and Keltner channels.
This will ensure that all aspects of price action, trend, and market volatility are covered for a comprehensive trading strategy.
The ATR indicator is available on our online trading platform, WebTrader. Our award-winning platform allows traders to customize technical indicators and tools, add drawing tools to price charts and graphs, and identify chart patterns in order to improve their trading strategy.
How to calculate ATR - Average true range formula
A new ATR reading is calculated as each time period passes. On a one-minute chart, a new ATR reading is calculated each minute. On a daily chart, a new ATR is calculated each day. All these readings are plotted to form a continuous line, so traders can see how volatility has changed over time.
Because the ATR is based on how much each asset moves, the reading for one asset isn't compared to other assets in isolation. To understand this technical indicator better, here is how it is calculated.
Finding the A, or the average first requires finding the True Range (TR).
The TR is the greatest of the following:
- Current high minus the previous close
- Current low minus previous close
- The current high minus the current low
Whether the number is positive or negative doesn't matter. The highest absolute value is used in the calculation.
The values are recorded each day, and then an average is taken. If the ATR is averaged over 14 time periods, then the ATR formula is as follows:
ATR = [(Prior ATR x 13) + Current TR] / 14
How to trade with ATR indicator
When you see the ATR volatility signals and you want to place a trade, you can do so via derivatives such as CFDs. Derivatives enable you to trade rising as well as declining prices. So, depending on what you think will happen with the asset’s price, you can open a long position or a short position using ATR as guidance for setting exit levels.
Follow these steps to trade with ATR:
- Trading any type of technical indicator requires patience and the ability to wait for confirmation. ATR is used most to optimize stop-loss and take-profit levels.
- To get started trading with ATR, open an account. Choose between a live account to trade straight away or practice first on our demo account with virtual funds.
- Choose your financial instrument. ATR can be applied in all financial markets, especially those that are more volatile, such as forex, cryptocurrencies, and stocks.
- Explore our online trading platform. We offer a wide range of technical indicators that are not limited to ATR, as well as providing a range of order execution tools for fast trading, which in turn helps you to manage risk.
The below strategies for trading with ATR are merely guidance and cannot be relied on for profit.
ATR in Forex Trading
Traders use the ATR in FX to get an idea of how far a currency pair's price is expected to move on a daily basis. This information can be used to determine how far away a profit target/stop-loss can be placed from the entry.
For example, if the ATR is showing a value of 100 pips and the trend that you are observing has exceeded 100 pips, then the trend has a higher probability of coming to an end.
The following EurUsd price chart shows how a trader can use the ATR to see how far the price is likely to move.
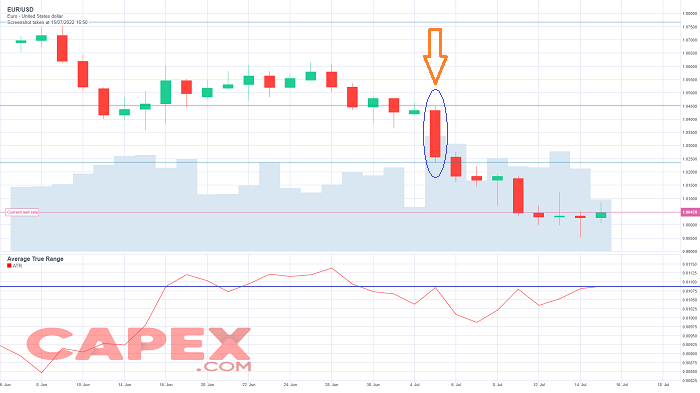
- At the time of the highlighted candle, the ATR is 109 pips, shown by the blue line and the value on the right-hand side of the indicator.
- A short entry is initiated at the start of the day.
- The profit target is placed using the ATR value of 109 pips.
Using the ATR for the stop loss
You can also use the ATR in to place your stop loss using the same principle. As the ATR gives you a good indication of how far the price will move, you can set your stop loss accordingly. By setting your stop loss away according to the daily range of the asset's price movement, you can effectively avoid market "noise" – temporary price movements up and down as the price moves in an overall direction.
If the price then reaches your stop loss, then this means that the daily price range is increasing in the opposite direction to your trade and you want to cut your losses short as soon as possible.
Using the ATR value is then optimal for placing a stop loss, because it allows you to place your stop loss the maximum distance away and avoid any market noise, whilst using the shortest stop loss possible to do so.
Final words about ATR Indicator
ATR is not a directional indicator like MACD, Stochastic, or RSI, but rather a unique volatility indicator that reflects the degree of interest or disinterest in a move. Strong moves, in either direction, are often accompanied by large ranges, or large True Ranges. This is especially true at the beginning of a move. Uninspiring moves can be accompanied by relatively narrow ranges. As such, ATR can be used to validate the enthusiasm behind a move or breakout. A bullish reversal with an increase in ATR would show strong buying pressure and reinforce the reversal. A bearish support break with an increase in ATR would show strong selling pressure and reinforce the support line break.
Summary:
- ATR is a smoothed moving average of volatility over a given time frame;
- It can be used on the forex, index, stock, and commodity markets;
- A 14-day moving average is the recommended basis for the average true range, but other periods can be used for shorter or longer timeframes;
- ATR is often used for assessing when and where to enter or exit a position, as well as at what price level to implement a trailing or guaranteed stop;
- However, while ATR is useful in these respects, you should use it in conjunction with other indicators to confirm forecasts.
Free trading tools and resources
Remember, you should have some trading experience and knowledge before you decide to trade with indicators. You should consider using the educational resources we offer like CAPEX Academy or a demo trading account. CAPEX Academy has lots of free trading courses for you to choose from, and they all tackle a different financial concept or process – like the basics of analyses – to help you to become a better trader.
Our demo account is a great place for you to learn more about leveraged trading, and you’ll be able to get an intimate understanding of how CFDs work – as well as what it’s like to trade with leverage – before risking real capital. For this reason, a demo account with us is a great tool for investors who are looking to make a transition to leveraged trading.