Grab Your Slice
of the Market
Trade over 2,100 instruments.
Join Zach King as he brings his magic to the world of trading. Grab your slice of the market with over 2,100 instruments and manage your portfolio with advanced trading tools on our powerful platform.
Be 1 of 20 winners to get $1,000 in their trading account.

All-In-One
Options create
opportunities
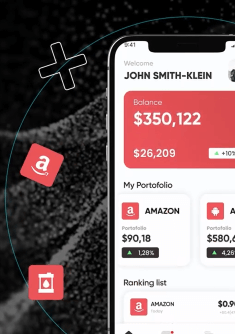
Instant access to over 2100 leveraged products on FX,
indices, commodities, bonds, and more.
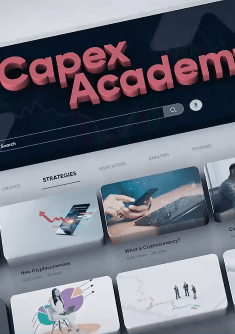
Capex
Academy
Tutorials, Analysis,
Charting, and Trends
Easy to use, packed with features. Analysis tools
from Trading Central, Insiders' Hot Stocks, Bloggers Opinions,
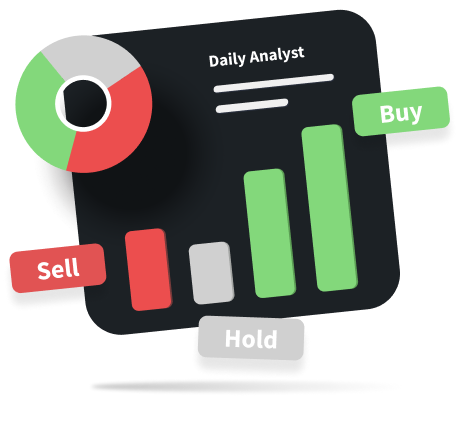
Daily Analyst Ratings, Hedge Funds Activity, and News
Sentiment from TipRanks.

- instrument
- buy
- sell
- 24h_change
- 24h_trend
On the move
Fast and reliable trading, always connected, on our full-featured mobile app for phones or tablets, iOS and Android.
app_rating
app_rating_text


app_rating
app_rating_text


Why traders
choose
CAPEX.com

Security
Segregated bank accounts keep your money safe & separated from ours
Regulated
Our 4 operating licenses adhere to the strict regulations of CySEC, ADGM, FSA, and FSCA
Reliable
Over 12 awards, recognising the top-notch quality of our products, services, technology, platforms, and tools that we deliver to our clients.
Global Presence
5 offices and local branches, 400+ employees
Knowledge is power
Empower yourself with trading knowledge.
Gain insight into how the markets work and the benefits of using various trading strategies. Start anywhere and learn at your own pace with our educational lessons.


LIVE CHARTS


